End-to-End Workflow
From First Flight to Load Compliance
Five interlocking layers of data collection, processing, and analysis — engineered to run at 950K+ pole scale.
🚁
Layer 1
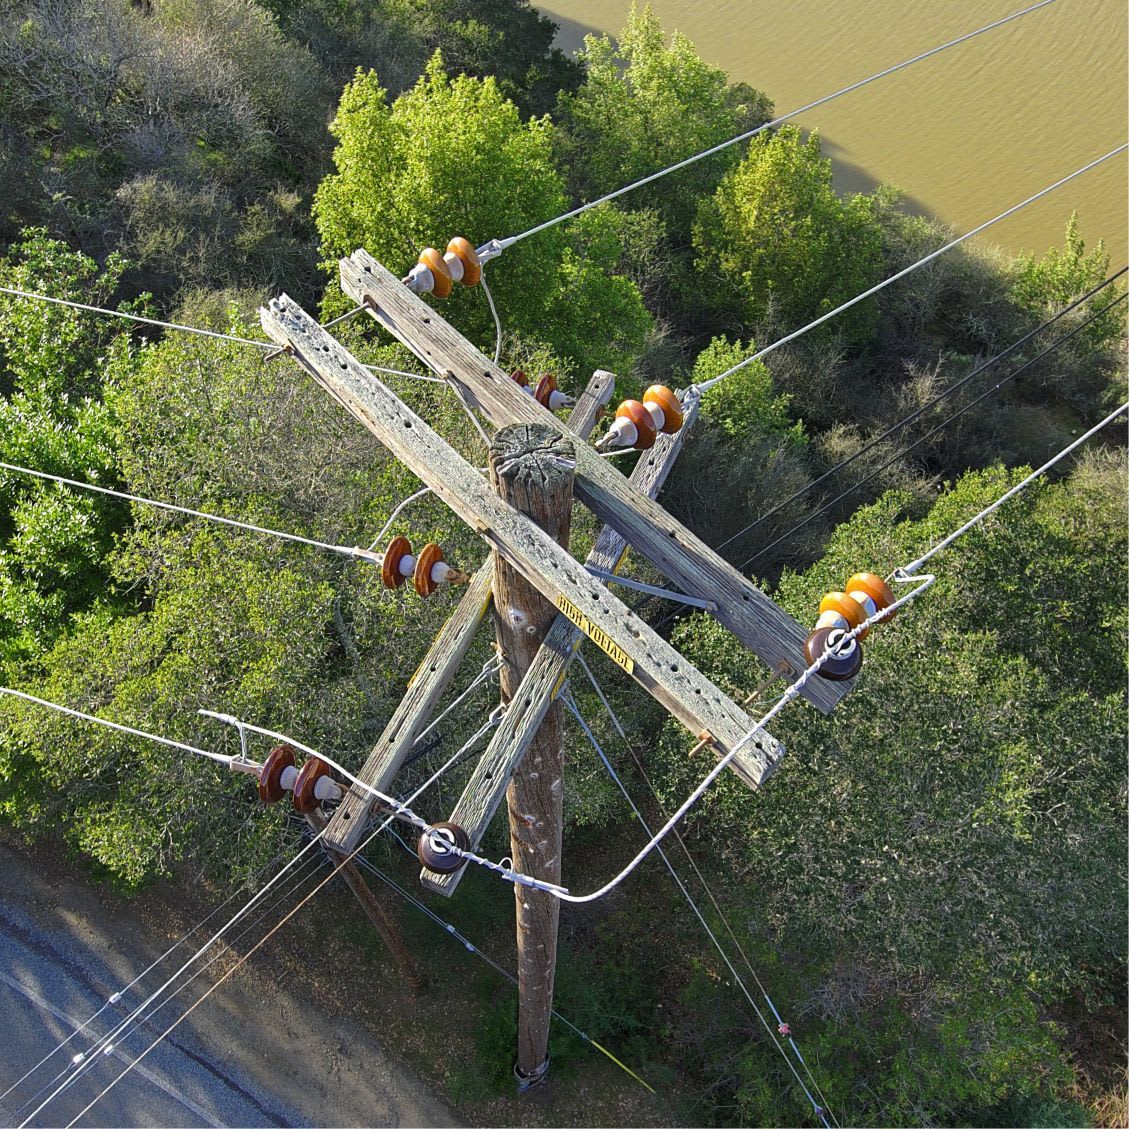
Drone Imagery
Pole existence, geo-verification, visual inspection, attachment inventory
🔬
Layer 2
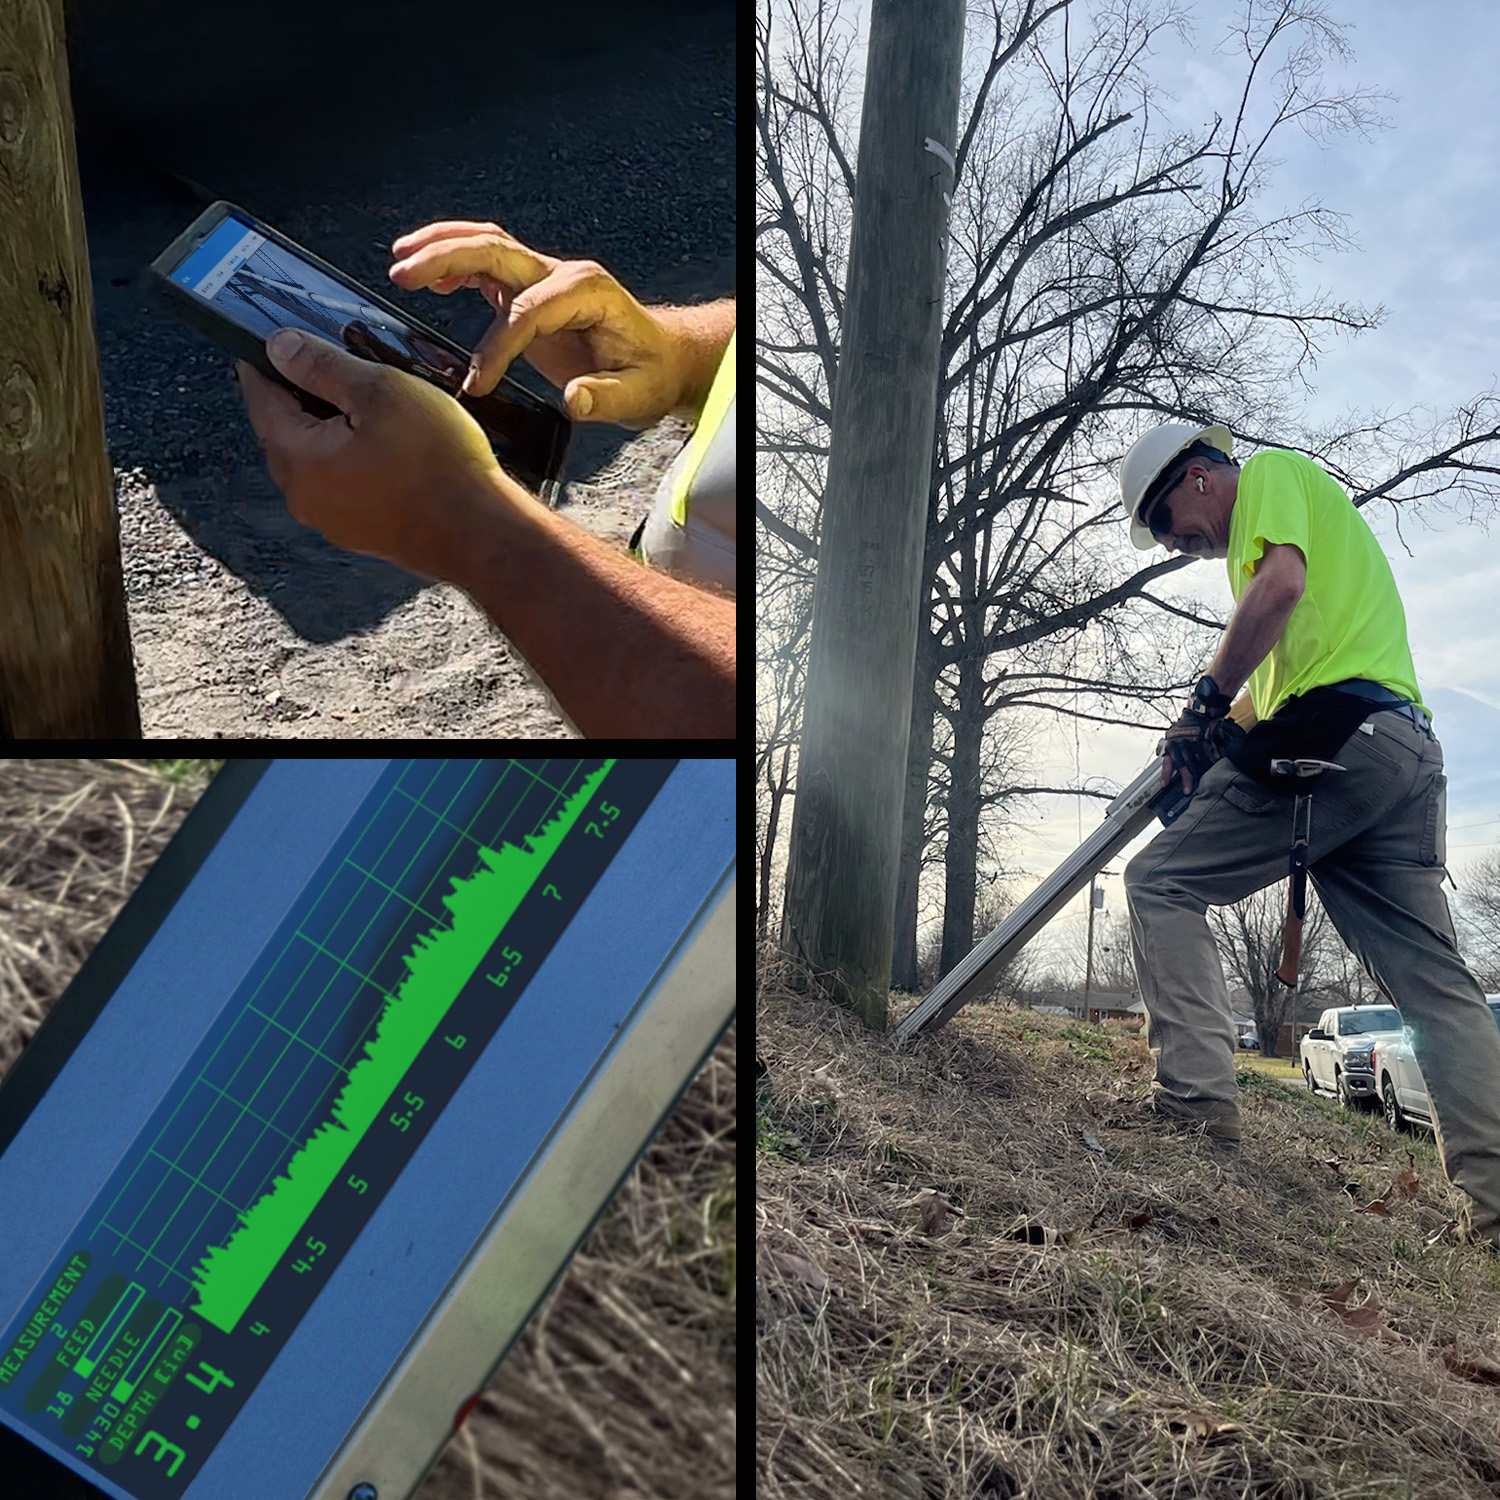
Groundline
Non-invasive integrity inspection, decay & moisture profiles, health scoring
📡
Layer 3
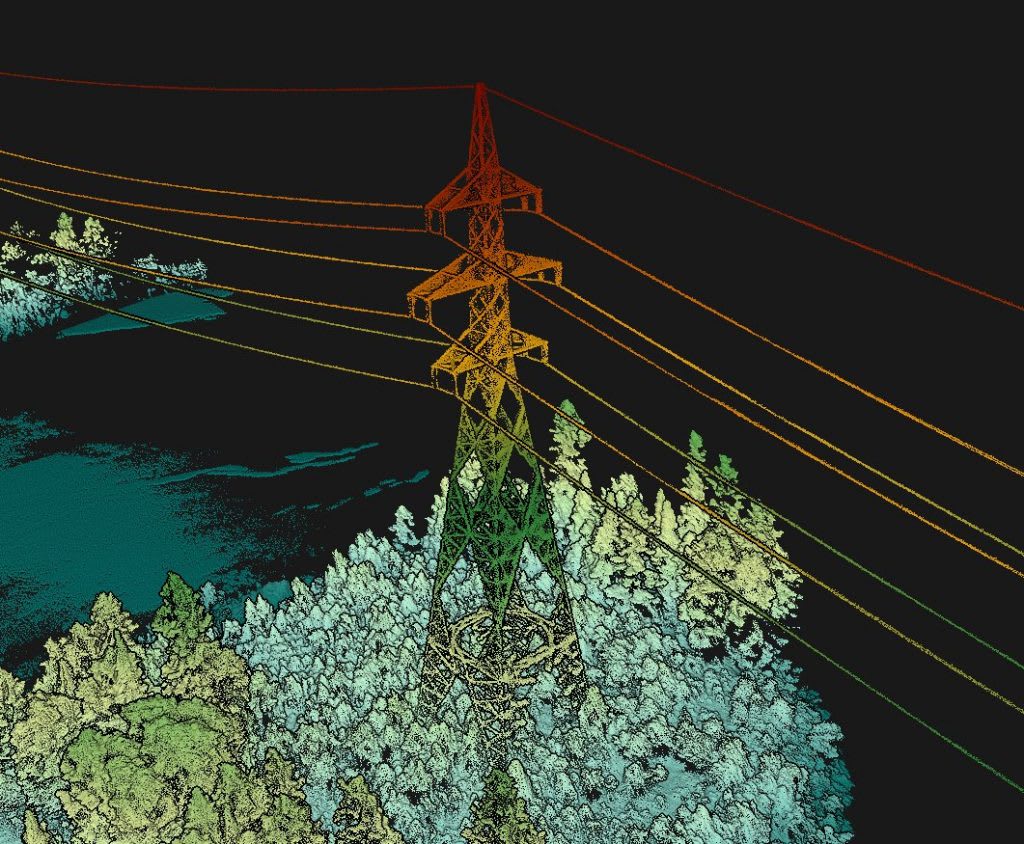
LiDAR Capture
Mobile → Aerial → Terrestrial point cloud fusion & feature extraction
⚙️
Layer 4
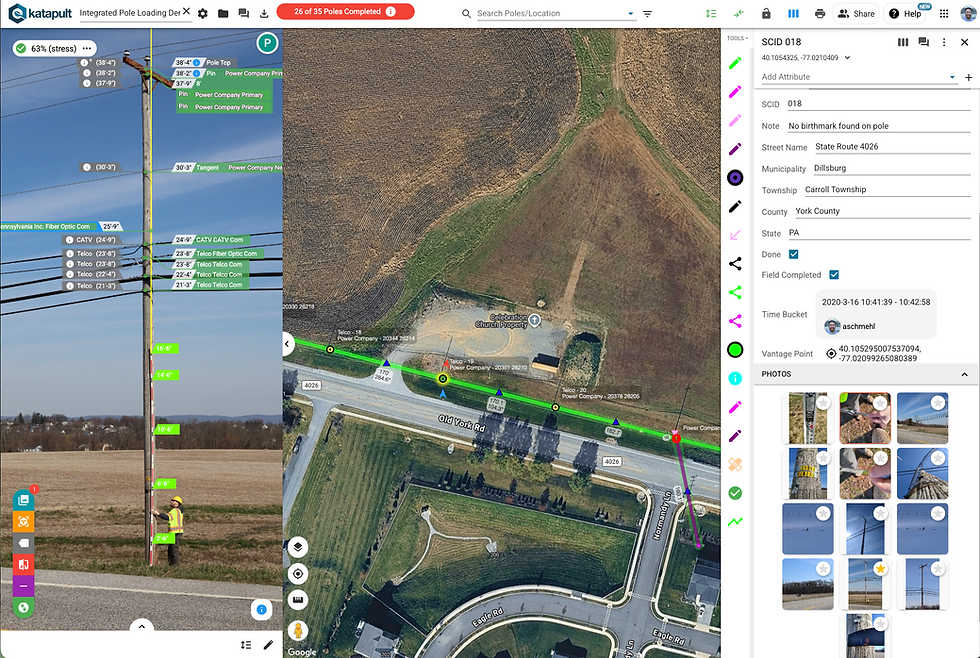
JSON → SPIDA
Automated schema compilation, cloud load calc via SPIDAstudio
🛡️
Layer 5
Risk Matrix
Real-time pole health index, weather modeling, remediation tracking
💡
The core idea: each layer enriches the pole record — drone data creates the foundation, groundline adds structural health, LiDAR adds precision geometry, SPIDA adds compliance status, and the risk matrix synthesizes everything into an actionable pole health score.